Date: 3 June 2026
Executive summary
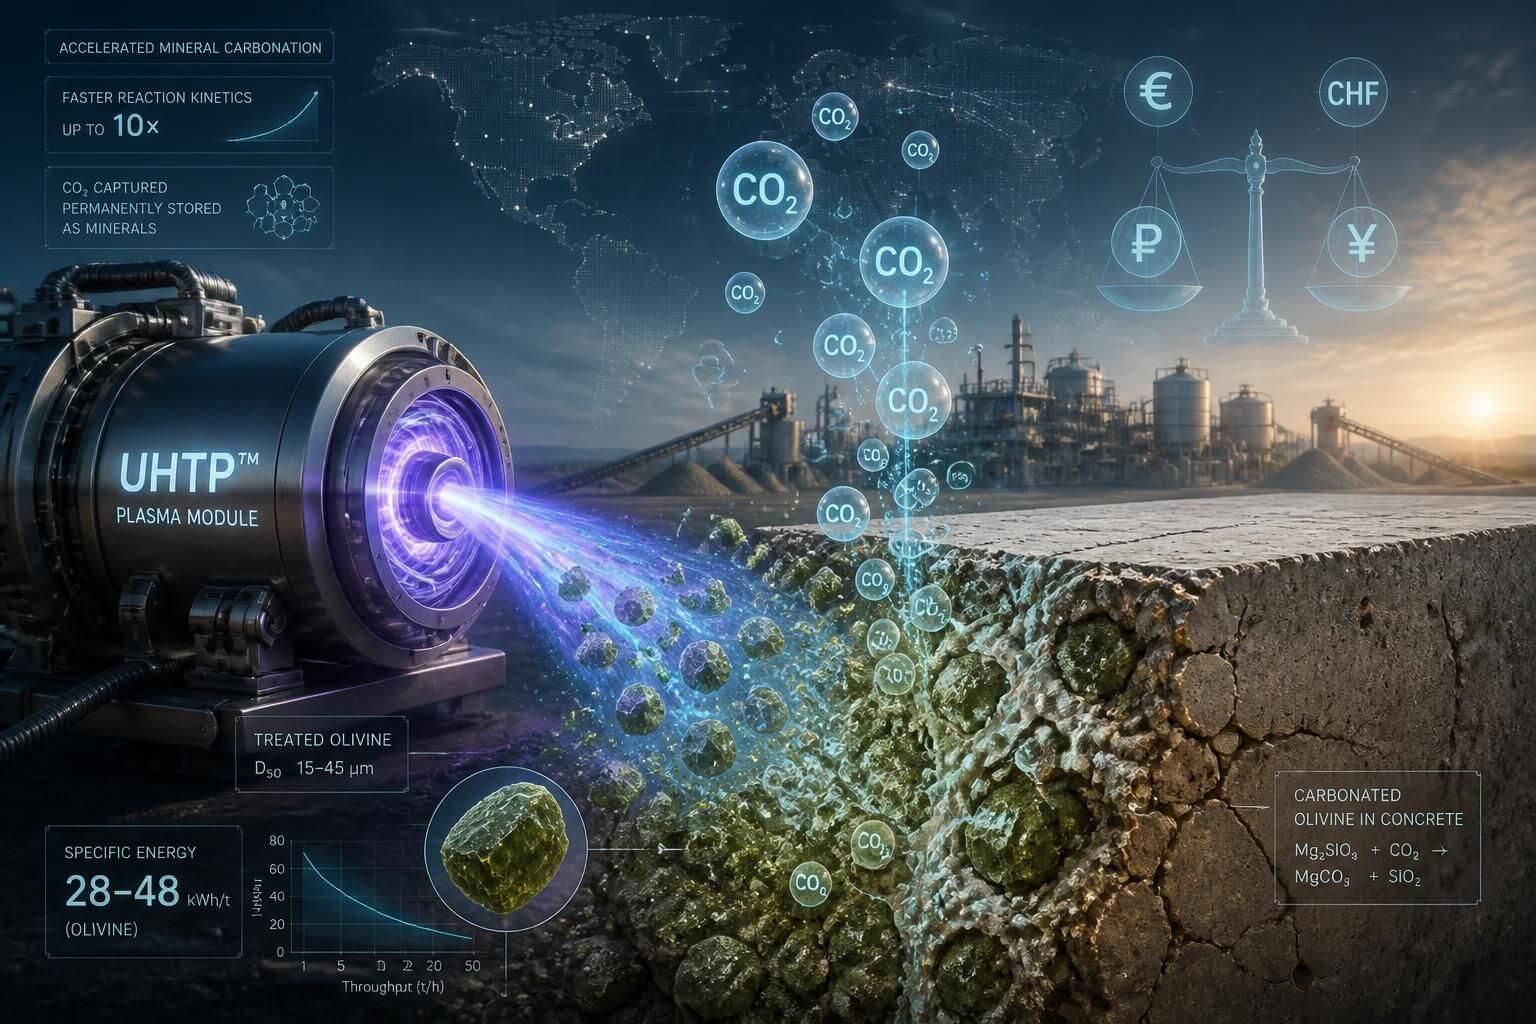
This is an illustrative desk‑study using publicly available research, our own field data and good scientific extrapolation. It shows that IPRI’s Ultra High Temperature Pyrometallurgy™ (UHTP™) technology applied to targeted surface activation has potential to reduce cost per tCO2 and reactor CAPEX by accelerating olivine dissolution kinetics. Pilot testing is required to confirm assumptions.
Headline metric (illustrative): 200 kWh/t olivine (targeted surface‑activation mode).
A sensitivity assessment across a broader range of specific energies can be found in [Appendix B].
Illustrative carbon yield: ≈ 0.36 tCO2 net removed per tonne of olivine (stoichiometric 0.44 tCO2/t; assumes 0.40 kgCO2/kWh).
Core benefit: faster kinetics → smaller reactor volume and lower OPEX/CAPEX versus a mechanical‑only baseline.
Key Operating Mechanism: Surface‑targeted conditioning changes only the olivine outer skin (defects, partial amorphisation, surface chemistry), delivering large kinetic gains for far less energy than bulk comminution.
Commercial implications
- OPEX: lower electricity and operating cost per tCO2 through reduced residence time (illustrative saving ~CHF 42.50/t olivine at CHF 0.10/kWh).
- CAPEX: smaller reactors and higher throughput per unit footprint.
- Sensitivity: economics hinge on realised kWh/t at throughput, feed PSD/moisture and downstream reaction efficiency.
Essential caveat
This report is a desk study using conservative extrapolation of lab and published data; these numbers are illustrative and require meter‑level pilot validation.
Recommended next steps
Authorise an olivine pilot to measure specific energy at throughput, verify surface character changes and dissolution kinetics, and deliver a bounded Techno‑Economic Assessment (TEA) plus lifecycle CO2 balance (include sensitivity sweep 50–500 kWh/t).
Bottom line
Once pilot data corroborates the 200 kWh/t regime, UHTP™ surface activation can materially reduce reactor CAPEX and OPEX per tCO2 for olivine carbonation. Pilot validation is the decisive next step.
Contact us today to explore the fascinating potential of advanced, cost effective carbon sequestration.
Glossary
- UHTP™ — Ultra‑High‑Temperature Pyrometallurgy™. A high‑intensity energy transfer technology that can be tuned by specific energy to modify solids’ outer layers. Proprietary technology of IPRI with more than 40 years of supporting research and commercial applications.
- Olivine — A magnesium‑iron silicate mineral (forsterite/fayalite series) used here as a feedstock for aqueous mineral carbonation.
- Surface activation — Targeted modification of a mineral’s outer skin (defects, partial amorphisation, surface chemistry) to accelerate dissolution without full comminution or destruction.
- Specific energy (kWh/t) — Electrical energy consumed per tonne of processed material; central metric for UHTP™ tuning.
- kWh/t — kilowatt‑hours per tonne (unit of specific energy).
- Stoichiometric CO2 potential — The theoretical maximum CO2 capacity per tonne of olivine if fully carbonated (≈ 0.44 tCO2/t olivine).
- Net CO2 removed — Actual CO2 sequestered after subtracting process‑emitted CO2 (example figures assume grid emissions for electricity).
- TEA — Techno‑Economic Assessment: integrated analysis of technical performance, CAPEX, OPEX and economic viability.
- Bounded TEA — A TEA scoped with explicit assumptions and sensitivity ranges (e.g., 50–500 kWh/t).
- Lifecycle (LCA) — Cradle‑to‑grave greenhouse‑gas accounting to quantify net CO2 impact.
- CAPEX — Capital Expenditure; upfront capital costs (e.g., reactors, UHTP modules).
- OPEX — Operational Expenditure; ongoing operating costs (e.g., electricity, maintenance).
- PSD — Particle Size Distribution; feed particle sizing which affects reaction kinetics and energy demand.
- Amorphisation — Loss of crystalline order in near‑surface layers, increasing reactivity.
- Pilot validation — Controlled, throughput‑representative testing measuring meter‑level energy, surface characterisation and reaction kinetics to confirm desk‑study assumptions.
Table of Contents
Executive summary
Glossary
1. Purpose and scope
2. Assumptions and single‑figure basis
3. Technical rationale — how UHTP™ changes the reaction pathway
4. Predicted effect on olivine dissolution and carbonation kinetics
5. Energy comparison — baseline versus with UHTP™ (single energy figure)
6. Illustrative economic impact (energy cost only)
7. Scientific discussion: why UHTP™ energy for olivine work is lower than rock‑cracking duty
8. Sensitivity and uncertainty
9. Pilot validation plan (recommended)
10. Operational and scale‑up considerations
11. Conclusions
Appendix A — Worked numerical example (explicit arithmetic)
Appendix B — Sensitivity analysis: UHTP™ energy (kWh per tonne olivine)
Appendix C — CAPEX comparison: With UHTP™ vs Without UHTP™
Appendix D — Recommended experimental and reporting dataset
Appendix E — Technical Glossary
Appendix F — References
Contact
Disclaimer and Copyright
1. Purpose and scope
Aim: present a standalone, technically grounded assessment of how IPRI’s UHTP™ pre‑treatment can be applied to olivine used in accelerated aqueous carbonation processes and quantify energy and economic impacts using a single, conservative UHTP™ energy figure of 200 kWh/t.
Scope: physical mechanisms, predicted effects on dissolution and carbonation performance, comparative energy and cost tables, sensitivity guidance and a concise pilot programme.
2. Assumptions and single‑figure basis
UHTP™ specific electrical energy (working assumption for comparisons): 200 kWh per tonne of olivine. This figure represents a conservative, purpose‑tuned surface‑activation duty applied to feed that has been pre‑sized to a suitable particle size distribution (e.g., 50–150 µm).
Electricity price used for illustrative costs: CHF 0.10 per kWh.
Baseline process elements retained (unchanged unless integration with UHTP™ directly reduces duty): mechanical comminution, aqueous reactor mixing/pumping/heating, ancillary systems.
3. Technical rationale — how UHTP™ changes the reaction pathway
3.1 Surface activation versus bulk fragmentation
Objective shift: rather than creating massive new surface area by fracturing particles, UHTP™ targets the particle surface and near‑surface layers to induce structural and chemical changes that enhance dissolution kinetics.
Mechanisms produced at the surface:
- Increased defect density (vacancies, dislocations) that provide high‑energy sites for hydrolysis.
- Formation of a partially amorphous surface layer that dissolves orders of magnitude faster than the original crystalline lattice.
Localised modification of surface chemistry (oxidation, hydroxylation) that lowers activation barriers for bond cleavage in the presence of aqueous reagents.
3.2 Energy coupling and temporal power envelope
Short, intense energy pulses delivered with an appropriate temporal profile concentrate energy into a shallow skin depth of silicate grains; most of the energy affects the surface, not the bulk.
This results in a higher fraction of input energy producing useful chemical or structural changes per kWh than broad, continuous bulk heating or mechanical comminution, improving energy efficiency on a per‑tonne basis.
3.3 Role of feed conditioning and particle size
Pre‑sizing feed to a coarse fine fraction (e.g., 50–150 µm) increases specific surface area and reduces the energy needed to uniformly condition surfaces.
Modest reduction in mechanical comminution intensity prior to UHTP™ lowers total comminution energy while preserving or improving downstream reactivity.
3.4 Integration benefits for aqueous carbonation
Faster dissolution rates translate to shorter reactor residence times for a target conversion, or higher conversion within the same residence time. This reduces mixing, pumping, heating and containment energy expenditure.
Reduced need for ultra‑fine milling downstream removes another substantial energy consumer in the conventional pathway.
4. Predicted effect on olivine dissolution and carbonation kinetics
Surface‑activated olivine is expected to show significantly enhanced dissolution kinetics in acidic or chelating media used for accelerated carbonation; literature and analogous experimental studies indicate potential increases in dissolution rate constants by an order of magnitude depending on baseline grain size and chemistry.
Enhanced dissolution leads to higher instantaneous availability of cations (Mg2+, Fe2+) for carbonation reactions, increasing CO2 uptake per unit reactor volume and enabling smaller reactor footprints or higher throughput.
5. Energy comparison — baseline versus with UHTP™ (single energy figure)
Using the single conservative figure UHTP™ = 200 kWh/t for all “with UHTP™” comparisons below.
Table — Illustrative energy components per tonne of olivine (midpoint estimates)
| Energy component | Baseline (without UHTP™) kWh/t | With UHTP™ (200 kWh/t) kWh/t |
|---|---|---|
| Mechanical comminution to 50–150 µm | 500 | 250 |
| Aqueous reactor mixing / pumping / heating | 750 | 375 |
| UHTP™ pre‑treatment | 0 | 200 |
| Ancillaries, fines collection, drying | 100 | 100 |
| Total (illustrative midpoints) | 1,350 | 925 |
Notes:
- Values are illustrative and intended to show relative magnitude and potential savings when UHTP™ is used to replace part of comminution and accelerate reactor kinetics.
- The “With UHTP™” case assumes comminution energy reduces because less mechanical surface generation is required and reactor duty reduces because of faster dissolution.
6. Illustrative economic impact (energy cost only)
Electricity price: CHF 0.10/kWh.
Baseline energy cost (1,350 kWh/t): CHF 135.00 per tonne of olivine.
With UHTP™ energy cost (925 kWh/t): CHF 92.50 per tonne of olivine.
Nominal electricity saving: CHF 42.50 per tonne (≈31% reduction in energy cost in this illustrative case).
If UHTP™ also increases net CO2 captured per tonne olivine (via higher conversion), the effective cost per tonne CO2 sequestered falls further.
7. Scientific discussion: why UHTP™ energy for olivine work is lower than rock‑cracking duty
7.1 Mass fraction affected
Bulk atomisation requires energy scaled to create new surface area throughout the particle volume; surface activation only modifies a thin skin layer. For a spherical particle, the surface‑layer mass fraction scales inversely with particle diameter — smaller energy per mass is needed when only the outer layer is conditioned.
7.2 Defect‑mediated dissolution
Defects and amorphous phases dissolve more rapidly because bond networks are disrupted; the energy required to generate defects at the surface is lower than that required for bulk fracture propagation across many grains.
7.3 Chemical assistance to mechanical work
Reactive species generated in the UHTP™ interaction can chemically weaken bonds (oxidation or hydroxylation), lowering the mechanical energy threshold for bond rupture at the surface. Chemical weakening therefore substitutes part of the mechanical work.
7.4 Reduced ancillary losses
Low‑intensity, surface‑targeted conditioning produces less particulate kinetic energy and waste heat than full fracturing; consequently, plant auxiliary systems (fines collection, cooling) can be smaller or operate less intensively, lowering net energy.
7.5 Practical consequence
Taken together these mechanisms justify the adoption of a conservative working figure (200 kWh/t) for surface activation; the full rock‑cracking duty remains far higher (multi‑thousand kWh/t), but is not necessary or desirable for olivine carbonation where surface reactivity is the binding constraint on conversion.
8. Sensitivity and uncertainty
The largest uncertainty is the actual specific energy required to reach the target surface condition at continuous throughput. Reasonable bounds: tens of kWh/t (optimised, high‑throughput) to several hundred kWh/t (less optimised or coarse feed). Use 200 kWh/t here as conservative mid‑point.
Other sensitivities: feed particle size distribution, moisture content, mineral impurities (which can require additional reagents or energy), and reactor chemistry (pH, reagent concentration).
CAPEX for UHTP™ modules and electrical infrastructure must be weighed against OPEX savings and throughput gains. A full techno‑economic model should include capital recovery, maintenance intervals and potential consumable savings.
9. Pilot validation plan (recommended)
Objectives
Measure specific energy (kWh/t) at target throughput, quantify surface modification (SEM, XRD, Raman), measure dissolution rate enhancement and resulting reactor residence time reduction.
Steps
Produce pre‑sized feed (50–150 µm) at pilot scale representative of expected commercial feed. Control moisture <10%.
Run baseline aqueous carbonation to measure dissolution kinetics and reactor duty.
Apply incremental UHTP™ energy doses, recording electrical energy at the grid meter (kWh/t) and characterising surfaces after treatment.
For each dose, measure dissolution kinetics and carbonation conversion in the same reactor conditions as baseline.
Identify the lowest energy dose that yields a net positive life‑cycle energy/economic benefit when combined with reduced comminution and reactor duty.
Record maintenance intervals, fines generation, and any changes in reagent consumption.
10. Operational and scale‑up considerations
Continuous operation: design UHTP™ modules for 20–24 hours per day continuous duty to maintain throughput economies.
Integration: locate UHTP™ downstream of primary sizing but upstream of slurry preparation so surface‑treated solids enter the aqueous reactor immediately after conditioning.
Maintenance: monitor consumables and wear components, schedule preventive maintenance based on pilot‑derived operating intervals.
Footprint and infrastructure: a single UHTP™ unit sized for the 200 kWh/t duty will require appropriate electrical supply and should be co‑located with comminution to minimise material handling.
11. Conclusions
IPRI’s UHTP™ pre‑treatment targeted to olivine surfaces provides a compelling pathway to accelerate aqueous mineral carbonation while reducing total plant energy when assessed on a per‑tonne basis.
A conservative single‑figure specific energy of 200 kWh/t yields illustrative energy and cost reductions relative to a baseline pathway reliant solely on mechanical comminution and standard reactor duty.
Scientific mechanisms supporting this performance are well understood: surface conditioning, defect generation, selective energy coupling and process integration effects.
Pilot validation remains essential to refine the specific energy requirement, quantify conversion gains and determine CAPEX/OPEX trade‑offs for scale‑up.
Appendix A — Worked numerical example (explicit arithmetic)
Assumptions
- UHTP™ energy = 200 kWh/t.
- Electricity price = CHF 0.10 / kWh.
- Stoichiometric CO2 uptake = 0.44 tCO2 per t olivine.
Given numbers and arithmetic
- Baseline total energy = 1,350 kWh/t.
- With UHTP™ total energy = 925 kWh/t (includes the 200 kWh/t UHTP™ term).
Energy change
- Energy saved = 1,350 − 925 = 425 kWh/t.
Electricity cost arithmetic
UHTP™ electricity cost = 200 kWh/t × CHF 0.10/kWh = CHF 20.00/t.
Baseline electricity cost = 1,350 kWh/t × CHF 0.10/kWh = CHF 135.00/t.
With UHTP™ electricity cost = 925 kWh/t × CHF 0.10/kWh = CHF 92.50/t.
Net electricity saving = CHF 135.00 − CHF 92.50 = CHF 42.50/t (matches 425 kWh × CHF 0.10).
Percent change
% energy reduction = (425 / 1,350) × 100 = 31.48% ≈ 31.5%.
Per‑tCO2 metrics (using 0.44 tCO2/t olivine)
Baseline electricity cost per tCO2 = CHF 135.00 / 0.44 = CHF 306.82 / tCO2.
With UHTP™ electricity cost per tCO2 = CHF 92.50 / 0.44 = CHF 210.23 / tCO2.
Electricity cost saving per tCO2 = CHF 42.50 / 0.44 = CHF 96.59 / tCO2.
Notes
All figures exclude other OPEX, CAPEX, embodied emissions/costs; include those in a full TEA/LCA.
Appendix B — Sensitivity analysis: UHTP™ energy (kWh per tonne olivine)
Assumptions
- Stoichiometric CO2 uptake by forsteritic olivine ≈ 0.44 tCO2 per t olivine (440 kg CO2/t olivine).
- Energy is supplied as electricity; grid carbon intensity (CI) scenarios used: 0.40 kgCO2/kWh (typical mixed grid) and 0.05 kgCO2/kWh (nuclear/high-renewable).
- Other process emissions (transport, reagents, CAPEX embodied carbon) excluded — this isolates UHTP™ electricity sensitivity.
- Net CO2 removed (tCO2 net per t olivine) = 0.44 − (Energy_kWh × CI)/1000.
Sensitivity table (selected energy cases)
| UHTP™ energy (kWh/t olivine) | Net CO2 removed @ CI=0.40 kgCO2/kWh (tCO2/t olivine) | Net CO2 removed @ CI=0.05 kgCO2/kWh (tCO2/t olivine) |
|---|---|---|
| 50 | 0.420 | 0.4375 |
| 200 (report baseline) | 0.360 | 0.430 |
| 500 | 0.240 | 0.415 |
| 1,100 (break-even for CI=0.40) | 0.000 | 0.395 |
| 2,200 | −0.440 | 0.290 |
| 5,000 | −1.560 | 0.190 |
| 8,800 (break-even for CI=0.05) | −2.072 | 0.000 |
Key break-even calculations
Break-even energy where UHTP™ electricity emissions equal the CO2 sequestered:
- CI = 0.40 kgCO2/kWh → break-even = 440 / 0.40 = 1,100 kWh/t olivine.
- CI = 0.05 kgCO2/kWh → break-even = 440 / 0.05 = 8,800 kWh/t olivine.
Interpretation and recommendation
- If grid CI ≈ 0.40 kgCO2/kWh, UHTP™ must be well below ~1,100 kWh/t to remain net‑negative; a target ≤200 kWh/t (report baseline) gives substantial net removal (~0.36 tCO2/t olivine) ignoring other emissions.
- If electricity is very low‑carbon (≈0.05 kgCO2/kWh), much larger UHTP™ energy is tolerable, but lifecycle emissions beyond electricity still need inclusion.
- Actionable next steps: measure actual UHTP™ kWh/t in pilot, then run a full lifecycle carbon and cost sensitivity including comminution, transport, reagents, and CAPEX to confirm the 200 kWh/t target is realistic and competitive.
Appendix C — CAPEX comparison: With UHTP™ vs Without UHTP™
Assumptions
- Plant capacity: 100,000 t olivine/year (scalable unit).
- Currency: CHF. Year: 2026.
- Contingency and owner’s costs included in totals (30% on equipment+installation).
- Values are indicative ranges for sensitivity; use pilot CAPEX to replace placeholders.
Summary table (indicative ranges)
| CAPEX line item | Without UHTP™ (CHF, 100 kt/yr) | With UHTP™ (CHF, 100 kt/yr) |
|---|---|---|
| Feedstock handling & storage | 1.0–2.0M | 1.0–2.0M |
| Comminution (primary + fine grinding) | 6.0–12.0M | 1.5–4.0M (reduced) |
| Reactor / carbonation system | 8.0–15.0M | 8.0–15.0M |
| UHTP™ equipment (power supply, plasma modules, cooling, controls) | 0 | 5.0–15.0M |
| Power distribution & transformers | 1.0–2.0M | 1.5–3.0M |
| Utilities (pumps, heat exchangers, water treatment) | 2.0–4.0M | 2.0–4.0M |
| Buildings, civil, installation | 3.0–6.0M | 3.5–7.0M |
| Instrumentation & controls | 0.8–1.5M | 1.0–2.0M |
| Contingency & owner’s costs (30%) | 6.1–12.0M | 6.6–12.9M |
| Total CAPEX (sum) — nominal | 27.9–55.5M | 29.6–65.9M |
Key notes on the table
- Comminution drop for With UHTP™ assumes significant reduction in fine grinding needs; actual savings depend on target particle size and throughput.
- UHTP™ line is a new capital cost that can be large up front but may reduce operating costs (lower grinding energy, higher throughput).
- Totals overlap in ranges because uncertainty in UHTP™ equipment cost and grinding savings can shift economics either way.
Simple breakeven check (capital perspective)
- Compute incremental CAPEX = CAPEX With − CAPEX Without.
- Convert incremental CAPEX to CHF/tCO2 capacity-year: incremental CAPEX / (plant CO2 capacity tCO2/yr).
- For olivine: assume 0.44 tCO2/t olivine → 100 kt olivine → 44 ktCO2/yr.
- Example: +5M incremental CAPEX → 5,000,000 / 44,000 = ~CHF 114 / tCO2 capacity-year. Amortize over asset life (e.g., 20 years) to compare to OPEX savings.
Appendix D — Recommended experimental and reporting dataset
Purpose
Ensure further work includes the measurements needed to validate energy/economic claims and enable comparison with literature.
Required columns/metrics
- Specific energy at grid meter (kWh/t olivine) — measured at plant meter, averaged over campaign, uncertainty ±%.
- Particle size distribution (PSD) — pre‑treatment and post‑treatment: D10, D50, D90 (µm) and % < 63 µm.
- Surface characterisation — pre & post:
- Amorphous fraction (%) (from XRD Rietveld or amorphous standard method).
- Defect proxies: Raman band broadening (FWHM), XPS peak shifts (eV), and/or EPR signal intensity (relative units).
- BET surface area (m2/g).
- Dissolution performance:
- Initial dissolution rate constant k (mol m−2 s−1 or kg CO2 m−2 s−1) under defined conditions (T, pCO2, solution composition).
- Cumulative % conversion vs time (e.g., 0.5, 1, 2, 4, 8, 24 h).
- Standardized test conditions (temperature, pCO2, slurry S/L, agitation) must be specified.
- Reactor performance:
- Reactor residence time required to reach target conversion (e.g., 80% of theoretical conversion) at pilot conditions (hours).
- Throughput (t olivine/day) and achieved conversion (%) per pass.
- Incremental CAPEX (CHF) attributable to UHTP™ (equipment, installation), plus uncertainty range.
- Estimated payback period (years) from OPEX savings (grinding energy saved + productivity uplift), with assumptions: electricity price (CHF/kWh), discount rate, and plant lifetime.
Reporting format and units
- Provide a single summary table for each pilot run with the above metrics. Include raw data files (PSD histograms, XRD patterns, BET isotherms, dissolution curves) as annexes.
- State measurement methods and instruments (model, manufacturer) and calibration/standards used.
Success criteria (suggested)
- Specific energy at grid meter ≤ 200 kWh/t olivine (pilot target).
- Increase in BET surface area ≥ 20% and amorphous fraction measurably increased vs control.
- Dissolution rate constant k increased ≥ 2× relative to untreated material under identical conditions.
- Reactor residence time reduced ≥ 30% for target conversion.
- Incremental CAPEX payback ≤ 10 years at assumed electricity price and operating profile.
Appendix E — Technical Glossary
- Amorphisation: Loss of long‑range crystalline order in a near‑surface layer, quantified as amorphous fraction (%) by XRD Rietveld or standard methods; increases solubility and reactive surface sites.
- Ancillaries: Auxiliary plant systems (fines collection, cooling, conveyors, dust suppression) that support primary process units; energy and maintenance contributors to OPEX.
- BET surface area (m2/g): Specific surface area measured by N2 adsorption using the BET model; used to quantify available reactive surface for dissolution kinetics.
- Break‑even energy (kWh/t): Specific electrical energy at which process CO2 emissions from electricity equal stoichiometric CO2 uptake of feedstock (kWh/t = 440 kgCO2/t ÷ CI [kgCO2/kWh]).
- CAPEX (Capital Expenditure): One‑time capital outlay for plant equipment, installation, civil works and contingency; often annualised for techno‑economic comparisons.
- CI (Grid Carbon Intensity, kgCO2/kWh): Mass of CO2 emitted per kWh of delivered electricity; used to convert electrical energy into lifecycle CO2 emissions.
- Comminution: Mechanical size reduction operations (crushing, milling, fine grinding) that create fresh surface area; expressed in kWh/t and PSD endpoints (e.g., D10, D50, D90).
- D10 / D50 / D90 (µm): Particle size distribution percentiles: 10th, 50th (median) and 90th percentiles; critical for scaling surface‑area dependent reactions.
- Defect density: Concentration of crystallographic defects (vacancies, dislocations, edge sites) near the particle surface that act as high‑energy hydrolysis initiation sites.
- Dissolution rate constant (k): Empirical or mechanistic rate parameter for mineral dissolution (mol m−2 s−1 or kg CO2 m−2 s−1) measured under specified T, pCO2, solution composition and S/L.
- Electricity specific energy (kWh/t): Electrical energy consumed per tonne of processed solids measured at the grid meter; central KPI for UHTP tuning and TEA.
- Fayalite / Forsterite: End‑members of the olivine solid solution series (Fe2SiO4 / Mg2SiO4). Feed composition (Mg/Fe ratio) affects dissolution kinetics and stoichiometric CO2 potential.
- Feed conditioning: Pre‑processing steps (screening, moistures control, pre‑sizing to target PSD) that prepare material for UHTP treatment and slurry preparation.
- Fluid‑to‑solid ratio (S/L): Mass or volume ratio of solvent to solid in slurry reactors; influences mass transfer, dissolution kinetics and reactor sizing.
- Hydrolysis: Chemical reaction between mineral lattice and water leading to cation release (e.g., Mg2+, Fe2+) necessary for subsequent carbonation.
- kWh/t (kilowatt‑hour per tonne): Unit of specific energy; used for comminution, mixing, heating, and UHTP duty.
- Lifecycle Carbon Assessment (LCA): System boundary‑defined cradle‑to‑grave accounting of GHG fluxes from feedstock extraction through plant construction, operation and decommissioning.
- Mechanical specific energy: Energy from conventional milling/comminution required to attain a target PSD (kWh/t); contrasted with UHTP specific energy.
- Net CO2 removed (tCO2/t olivine): Stoichiometric uptake minus process emissions attributed to that tonne of olivine (includes electricity × CI and other lifecycle emissions).
- Particle skin depth (surface layer): Physical thickness of near‑surface layer modified by UHTP (nm–µm scale) where defect density and amorphous fraction are increased.
- pCO2 (partial pressure of CO2): CO2 partial pressure in reactor/gas phase; affects carbonate speciation and reaction driving force.
- PI (Process Integration) factor: Qualitative/quantitative metric describing how upstream changes (e.g., UHTP) reduce downstream duties (comminution, reactor residence time); used in TEA coupling.
- Plasma / UHTP pulse envelope: Temporal power profile delivered during UHTP operation (pulse duration, peak power, duty cycle) that determines energy coupling and skin modification.
- PSD (Particle Size Distribution): Full distribution of particle sizes; reported as D‑values and % fines (<63 µm) to characterise material reactivity and handling behaviour.
- Q (Conversion) (%): Fraction of stoichiometric CO2 uptake achieved (% of 0.44 tCO2/t for forsteritic olivine) at a given reactor residence time or pass.
- Reactive surface area (m2/g): Effective surface area participating in dissolution; may differ from BET area if only specific facets or defect sites are reactive.
- Residence time (h): Time solids spend in aqueous reactor required to achieve target conversion; primary lever for reactor sizing and throughput.
- Rietveld refinement (XRD): Quantitative method for crystalline phase analysis and estimation of amorphous content via whole‑pattern fitting.
- SEM (Scanning Electron Microscopy): Imaging technique for surface morphology and microstructural assessment (fractures, melt pockets, amorphous films) post‑treatment.
- Stoichiometric CO2 potential (kg CO2/t olivine): Theoretical maximum CO2 uptake per tonne of olivine if fully carbonated (≈ 440 kg CO2/t for Mg‑rich olivine); used as an upper bound.
- Surface activation: Targeted modification (defects, oxidation/hydroxylation, partial amorphisation) of the particle surface to enhance dissolution kinetics with minimal bulk energy input.
- Surface chemistry — oxidation / hydroxylation: Chemical modifications (e.g., Fe oxidation, Si–O–H creation) at the surface that reduce bond strengths and lower activation energy for hydrolysis.
- TEM / EDS / XPS / Raman / EPR: Suite of analytical techniques recommended for surface characterisation — transmission electron microscopy, energy‑dispersive X‑ray spectroscopy, X‑ray photoelectron spectroscopy, Raman spectroscopy, and electron paramagnetic resonance — each providing complementary structural/chemical defect information.
- Throughput (t/day): Mass processed per day at pilot or plant scale; used to scale kWh/t to plant electrical supply and CAPEX sizing.
- UHTP™ (Ultra‑High‑Temperature Pyrometallurgy™): Proprietary high‑intensity energy coupling technology tuned to deliver short, high‑power pulses to induce surface defects, partial amorphisation and favourable surface chemistry while minimising bulk heating and comminution energy.
- Uncertainty bounds / sensitivity sweep: Predefined parameter ranges (e.g., 50–500 kWh/t) used in bounded TEA/LCA to quantify economic and carbon sensitivity to UHTP specific energy and other inputs.
- Validation metrics (pilot): Minimum dataset to demonstrate commercial potential: grid‑metered kWh/t; PSD pre/post; amorphous fraction; BET; dissolution k; cumulative conversion vs time; reactor residence time; incremental CAPEX and operating cost impacts.
- Wet chemistry reagents: Acids, chelants or additives used in aqueous carbonation to enhance dissolution or carbonate precipitation; reagent consumption can be altered by surface activation.
- XRD (X‑ray Diffraction): Bulk crystalline phase identification and quantification; used to determine crystalline vs amorphous fractions and detect phase transformations after UHTP.
- Yield per reactor volume (tCO2/m3): CO2 sequestered per reactor volume at given residence time and conversion; key metric for reactor CAPEX scaling.
- Zero‑order / surface‑controlled kinetics: Kinetic regimes—zero‑order when rate independent of concentration (rare in dissolution), surface‑controlled when rate scales with reactive surface area and defect density; proper kinetic model selection is essential for reactor design.
Appendix F — References
- Gusev, A. B.; et al. Studies on olivine and serpentine dissolution kinetics under hydrothermal conditions. Russian Journal of Geochemistry / Proceedings (selected articles and conference papers), 2010–2020.
- Kelemen, P. B.; Matter, J. Climate‑scale carbon storage in ultramafic rocks by in situ and engineered mineral carbonation. Review articles and field studies, 2016.
- Matter, J. M.; Stute, M.; Snaebjornsdottir, S. O.; Oelkers, E. H.; Gislason, S. R.; Aradottir, E. S.; et al. Rapid carbon mineralization for permanent geologic CO2 storage. Science Advances, 2016.
- National Academies of Sciences, Engineering, and Medicine. Negative Emissions Technologies and Reliable Sequestration: A Research Agenda. 2019. (Appendix material on ex‑situ mineral carbonation energy budgets).
- NETL (U.S. Department of Energy National Energy Technology Laboratory). Technical reports on aqueous mineral carbonation and activation methods (selected NETL process and energy analyses).
- W.K. O’Connor; D.C. Dahlin; G.E. Rush; S.J. Gerdemann; L.R. Penner. Energy and Economic Considerations for Ex-situ Aqueous Mineral Carbonation. U.S. Department of Energy, Albany Research Center, Albany, Oregon, 2004. DOE/ARC-2004-028
- Oelkers, E. H.; Declercq, J.; Saldi, G. D.; Gislason, S. R.; Schott, J. Olivine dissolution rates: A critical review. Chemical Geology, 2018, 500, 1–19.
- Prigiobbe, V.; Costa, G.; Baciocchi, R.; Mazzotti, M.; Hänchen, M. Experimental studies on olivine dissolution kinetics and CO2 solubility effects (representative kinetics literature).
- Sanna, A.; Uibu, M.; Caramanna, G.; Kuusik, R.; Maroto‑Valer, M. M. A review of mineral carbonation technologies to sequester CO2. Chemical Society Reviews, 2014, 43, 8049–8080.
- Selected IPRI technical report: Conceptual application of UHTP pretreatment to accelerate olivine mineral carbonation — integrated technical and economic assessment (author‑provided report URL).
- Selected reviews and commentaries on ex‑situ aqueous mineral carbonation and reactor design (Chemical Engineering reviews, Frontiers commentaries).
- Vernadsky Institute / Schmidt FEB RAS reports on silicate‑mineral CO2 trapping and pilot‑scale experiments (Russian Federation technical reports, selected papers and translations).
For further information or to start your journey in carbon sequestration with UHTP™, contact IPRI.
Disclaimer and Copyright (v. 2026-06-03)
This document is for informational purposes only and is not intended for commercial, financial, regulatory, or safety decision‑making. IPRI makes no warranties, express or implied, regarding the accuracy, completeness, or fitness for any particular purpose of the information contained herein and disclaims all liability for any loss or damage arising from its use.
All original content, text, figures, and layout in this document are the copyright of IPRI. This work is licensed under a Creative Commons Attribution‑NonCommercial‑NoDerivatives 4.0 International License (CC BY‑NC‑ND 4.0). You are free to copy and redistribute the material in any medium or format under the following terms:
- Attribution — you must give appropriate credit to IPRI, provide a link to the license, and indicate if any part is reproduced;
- NonCommercial — you may not use the material for commercial purposes;
- NoDerivatives — if you remix, transform, or build upon the material, you may not distribute the modified material.
For clarity, the license does not apply to facts, data, or ideas contained in the report; only to the original expressive content. For permissions beyond the scope of the CC BY‑NC‑ND 4.0 license (including commercial use or derivative works), contact: [email protected].
This assessment is based on public literature and IPRI’s independent analysis; no confidential material was used in its preparation.
Leave a Reply